
One of the largest and most popular areas of our region is Egg Harbor Township. I’d like to highlight some of the interesting market statistics derived from the multiple listing service to help home sellers and buyers in the area be aware of what is going on in the market.
This first chart shows the median for sale price and median sold price. We look at the February 2017 numbers and then go back to compare those number with a year ago. The median for sale price did not change. The median sold price went down by 14%.
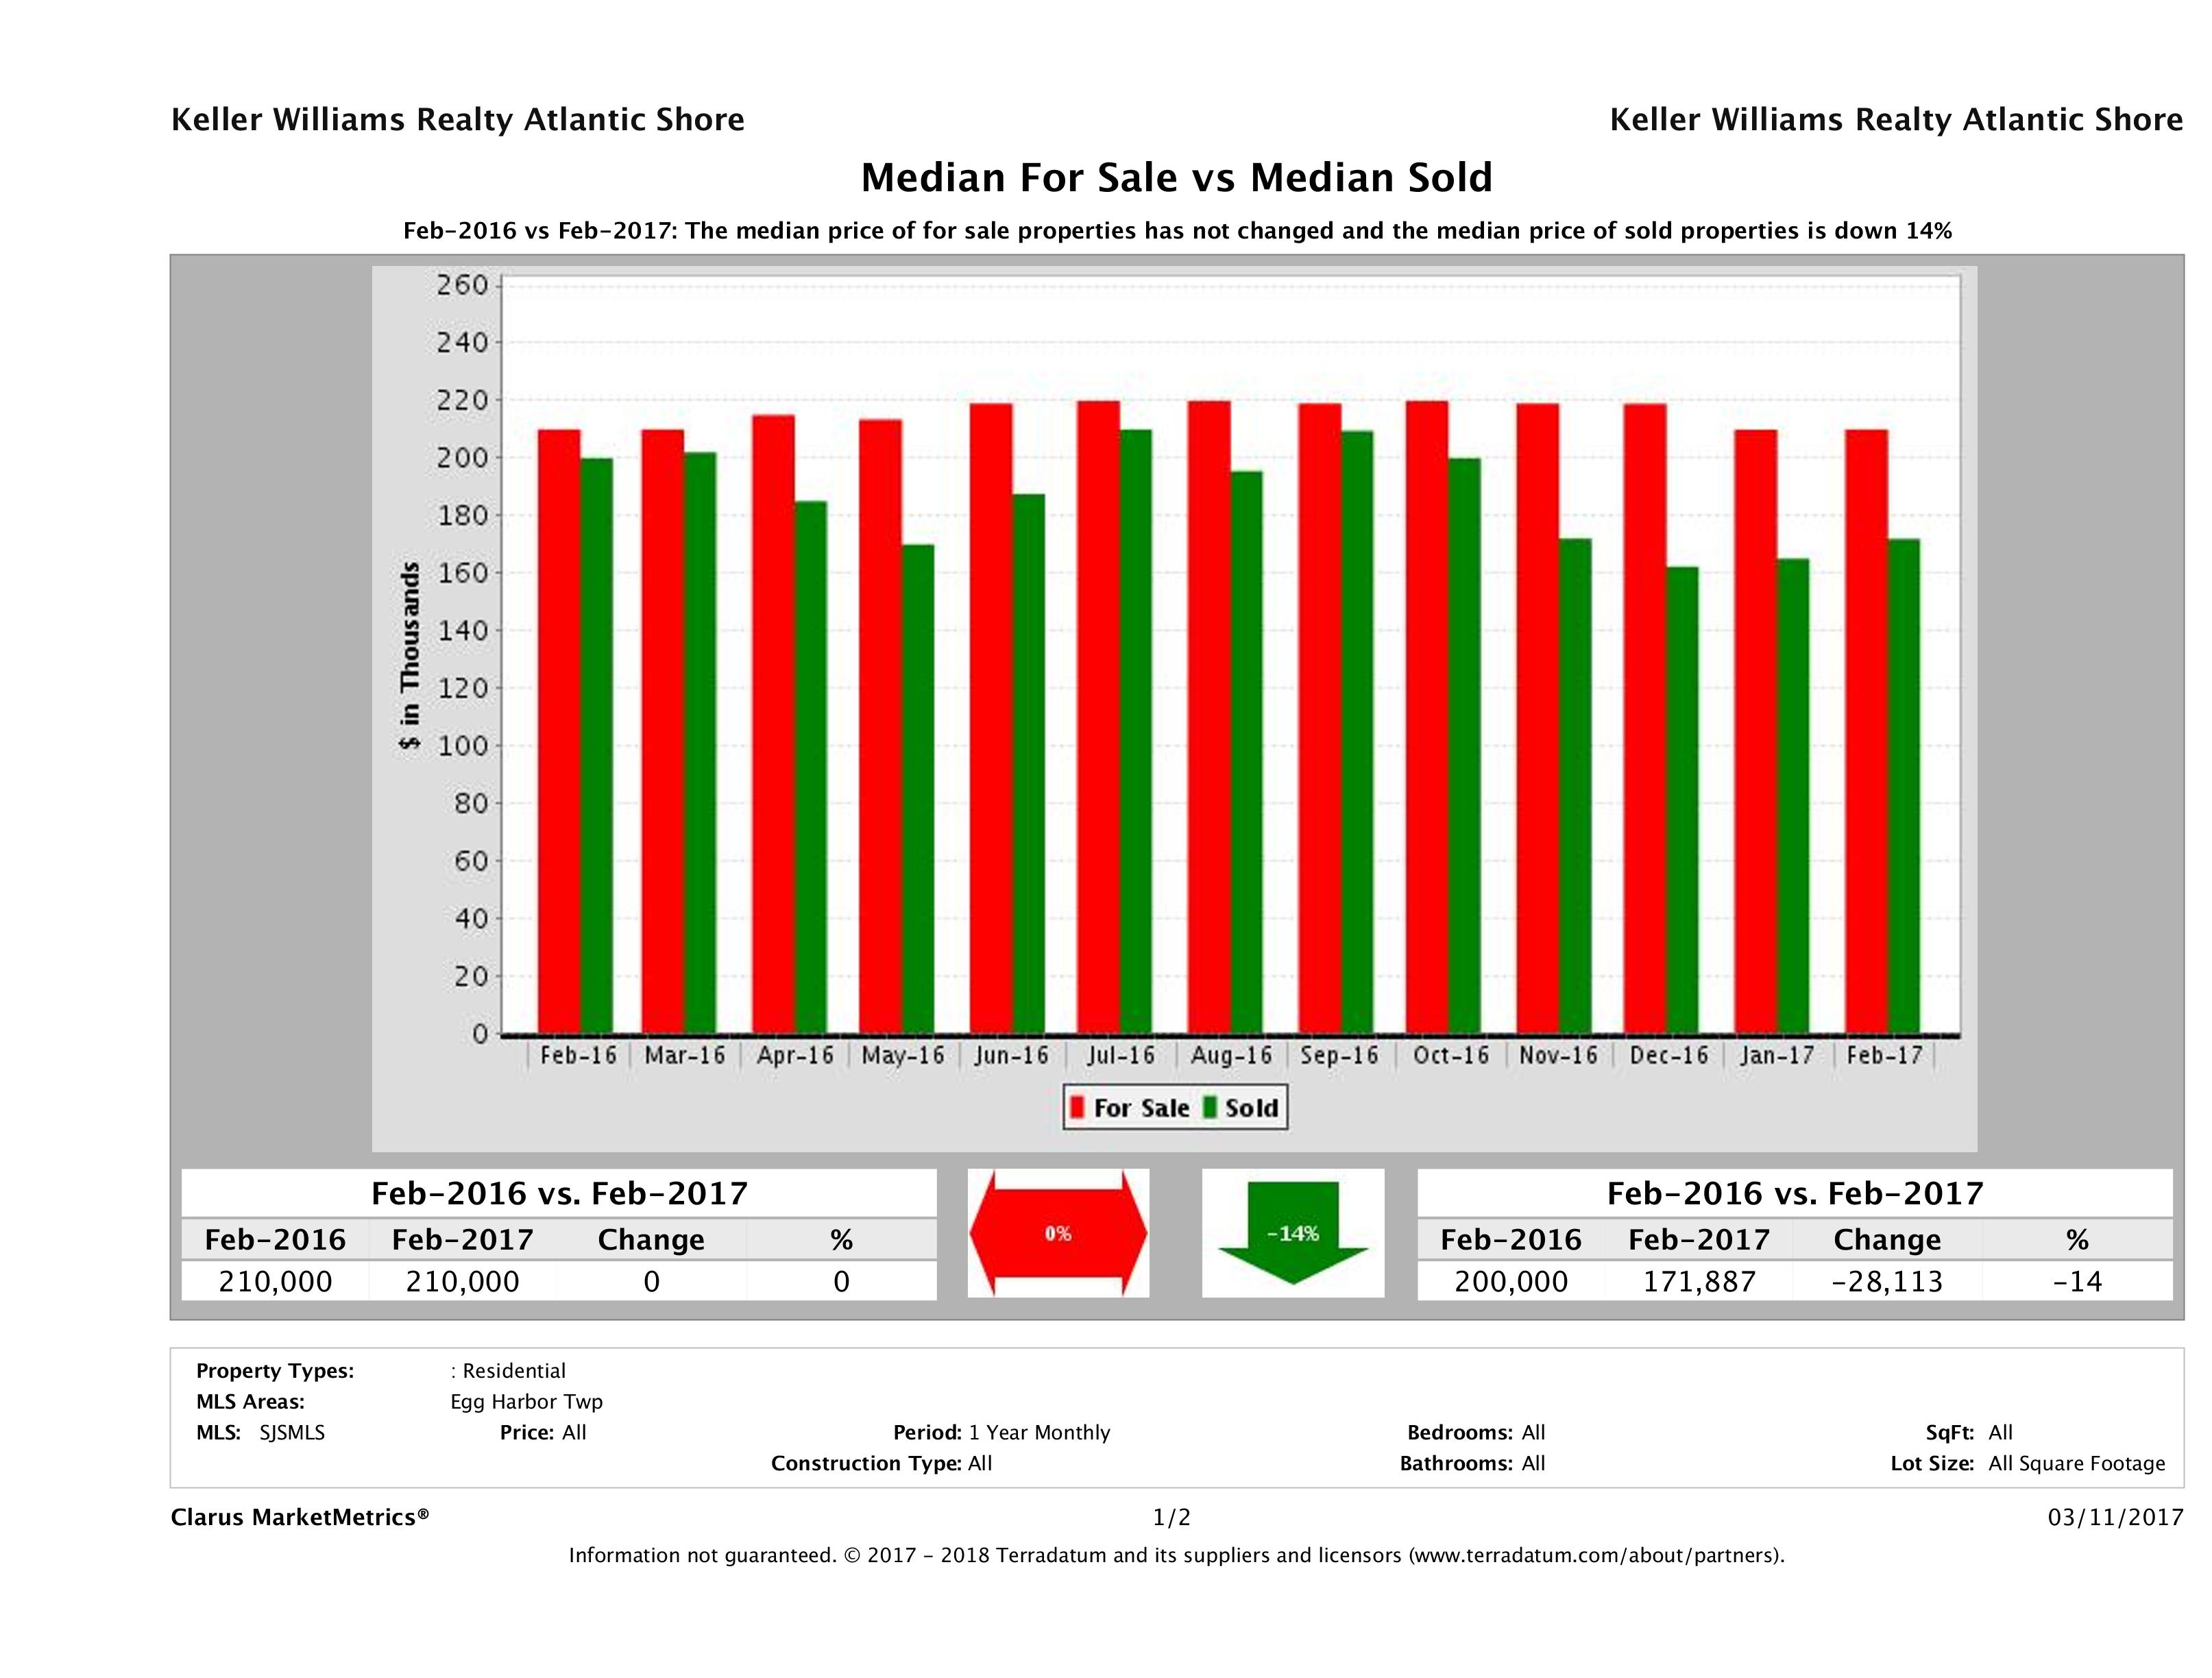
Egg Harbor Township, Median for sale and sold price. Feb. 2017.
The second chart shows supply and demand by month for Egg Harbor Township. The red bar shows the supply of homes for sale and the green bar shows the number of homes sold. Supply is down by 2% and sold properties are up by 3%. This is good news for sellers. You have less competition and more homes selling than this time a year ago.
The last chart shows the average days on the market up by 17% to 88 days on the market. In this market as a seller you do not want to be average. Our goal is to sell your home during the peak “window of opportunity” the first 4-5 weeks a home comes on the market.
Who do you know looking to sell or buy a home? Please call me for a complementary consultation.
Best wishes,
Matt
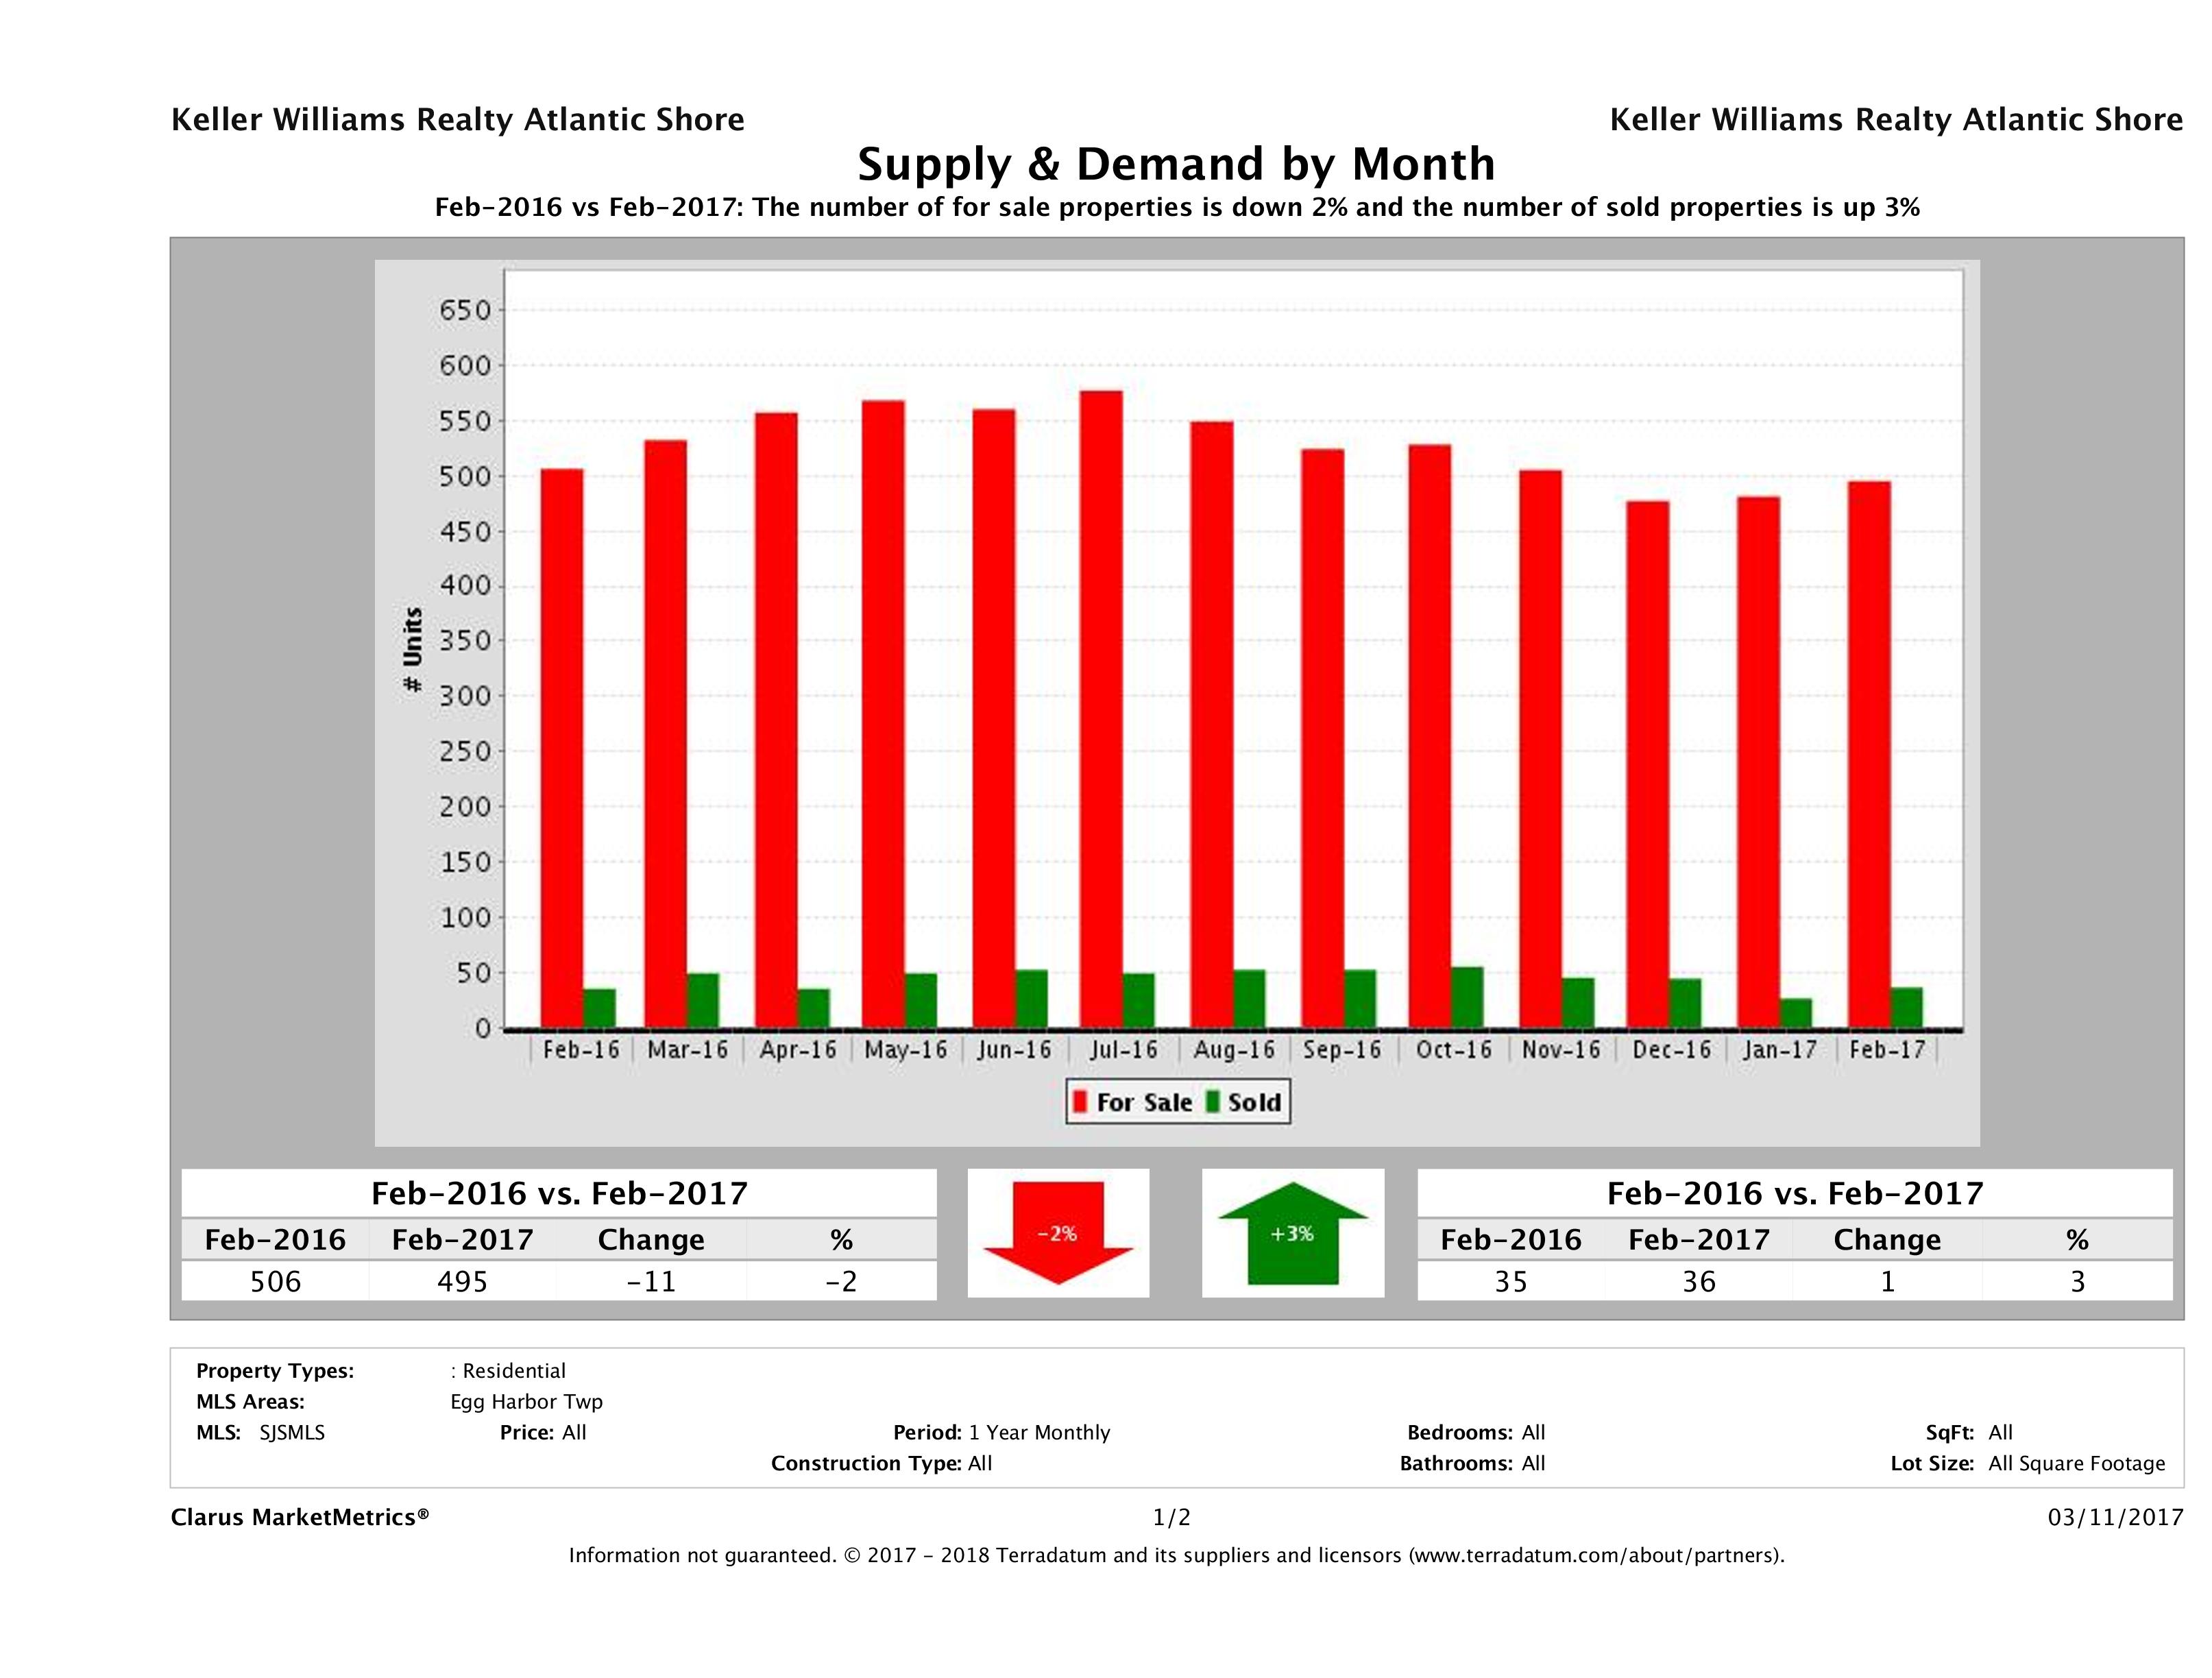
Supply and demand for Egg Harbor Township, NJ, Feb 2017
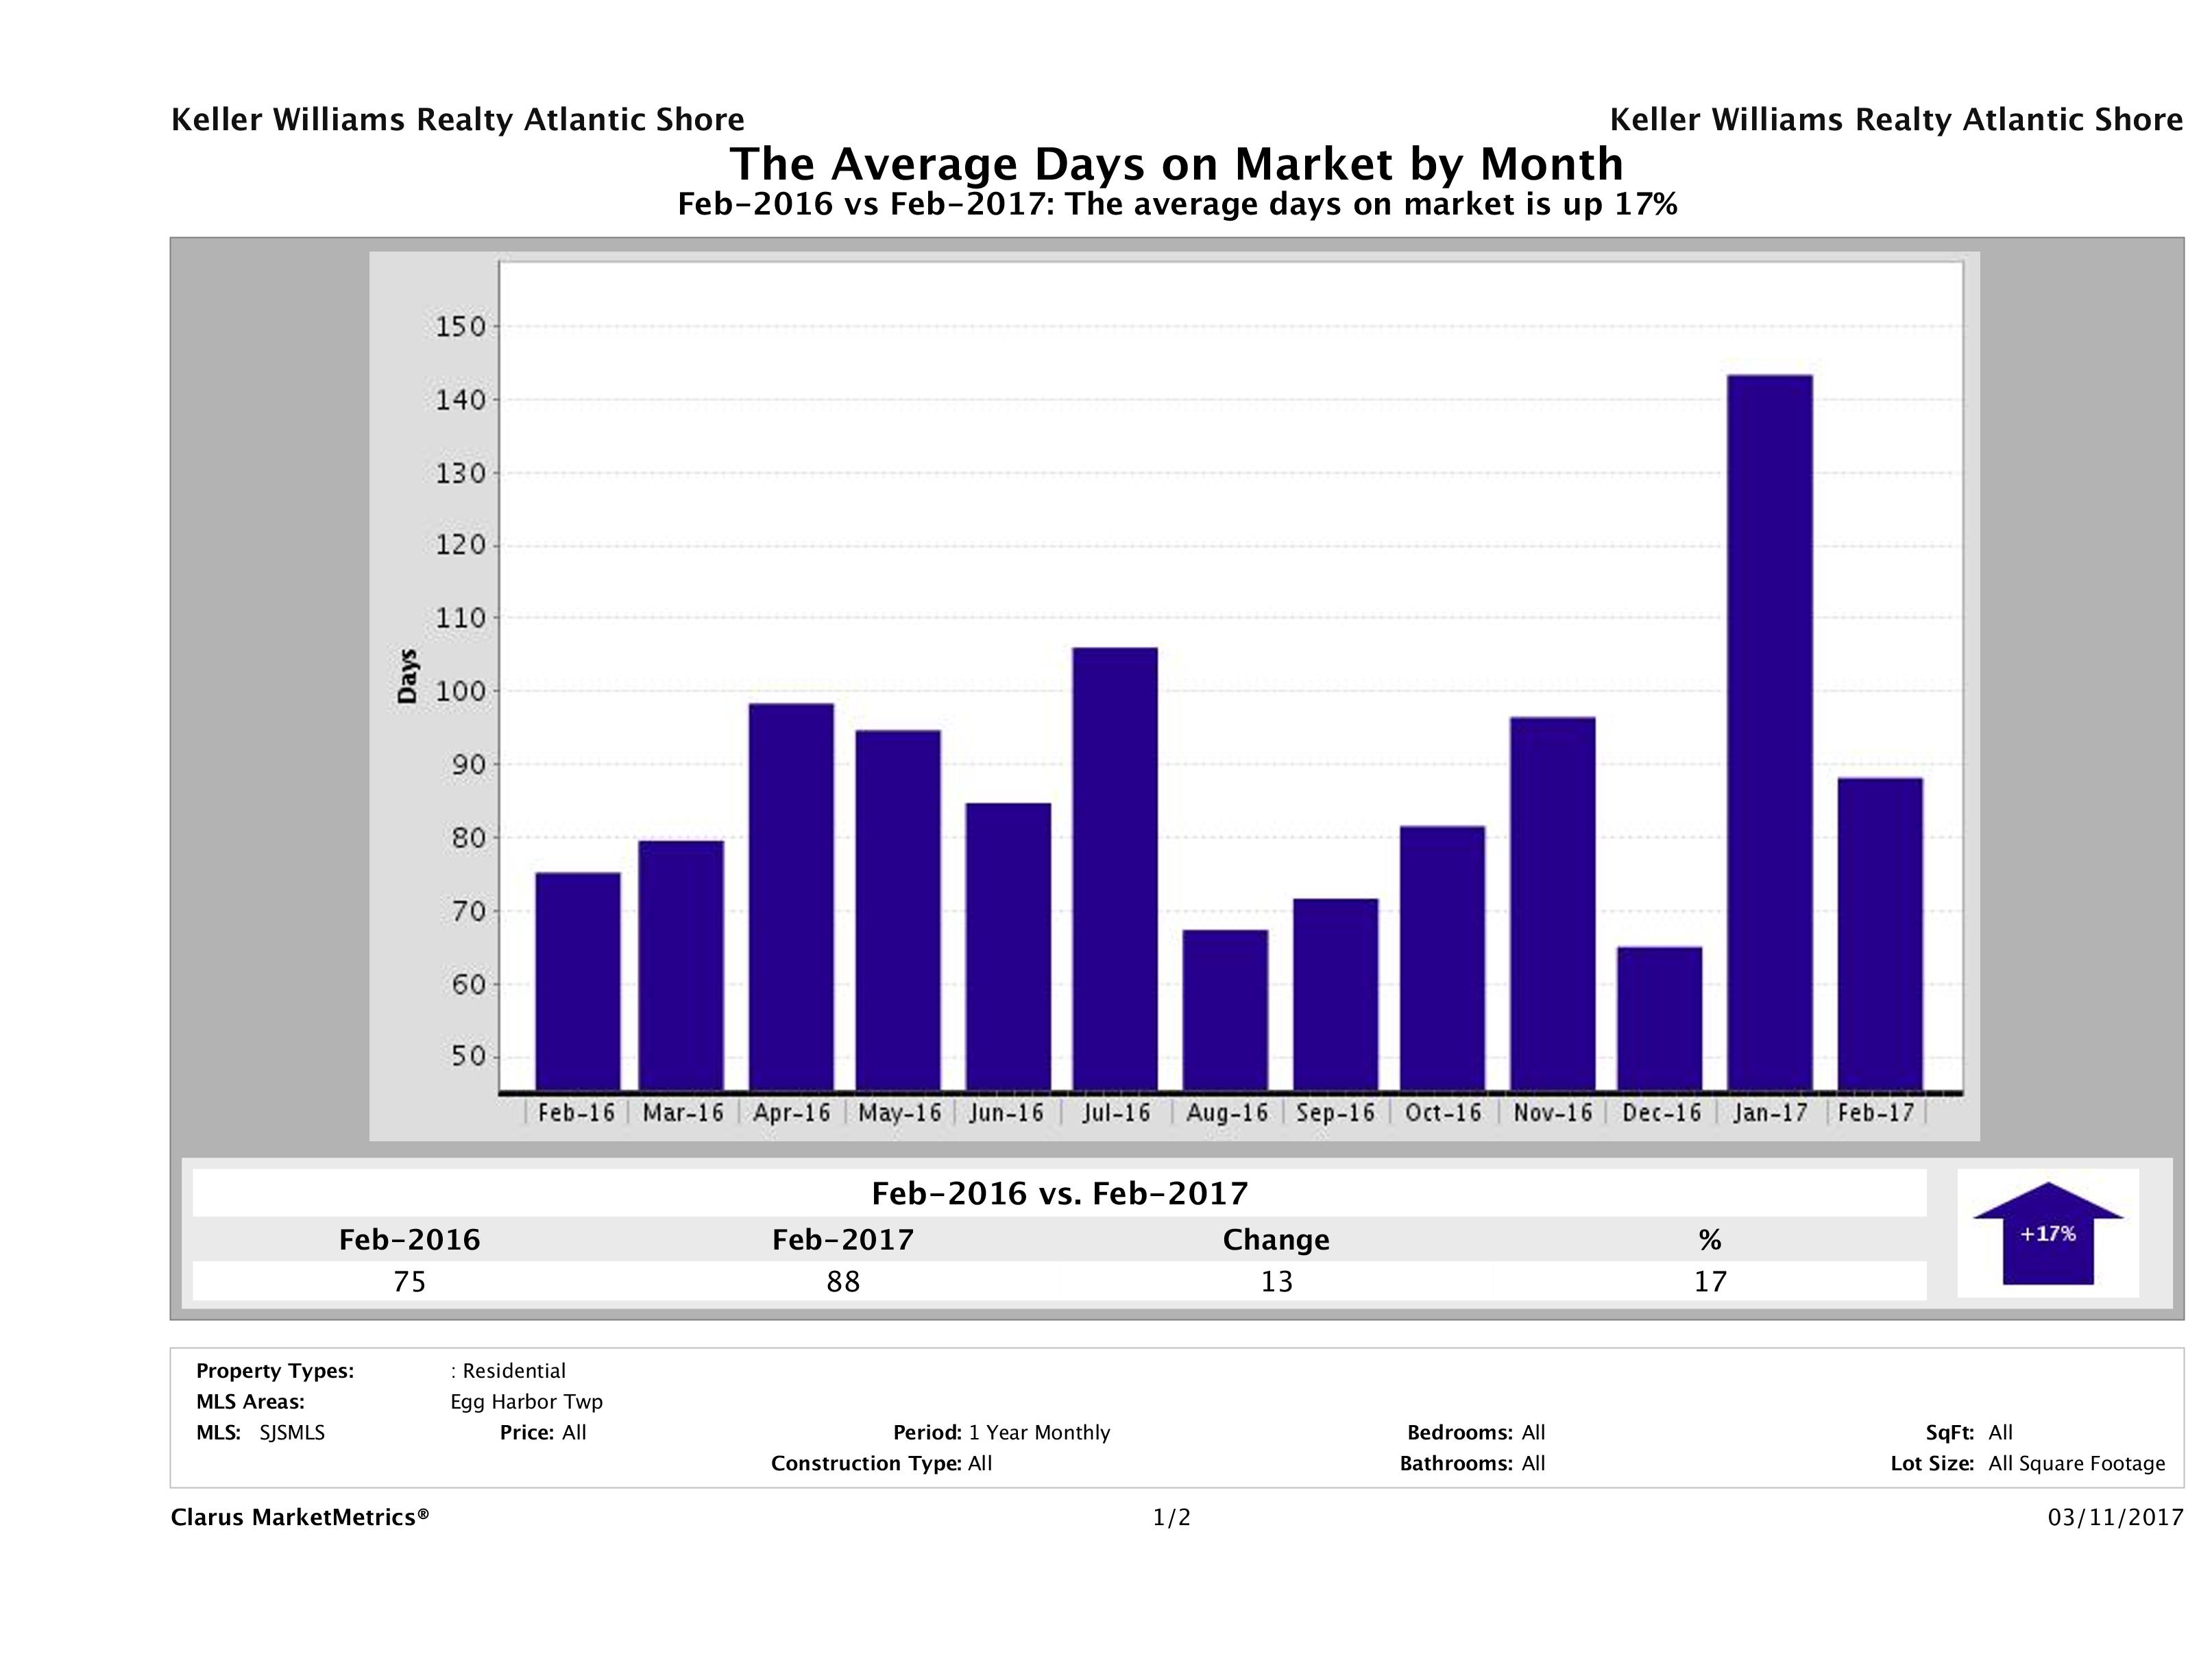
Average days on market for Egg Harbor Township, NJ Feb. 2017
Please note: I reserve the right to delete comments that are offensive or off-topic.