Egg Harbor Township, NJ Real Estate Market Trends

Here's an update on what's happening in the Egg Harbor Township Real Estate Market.

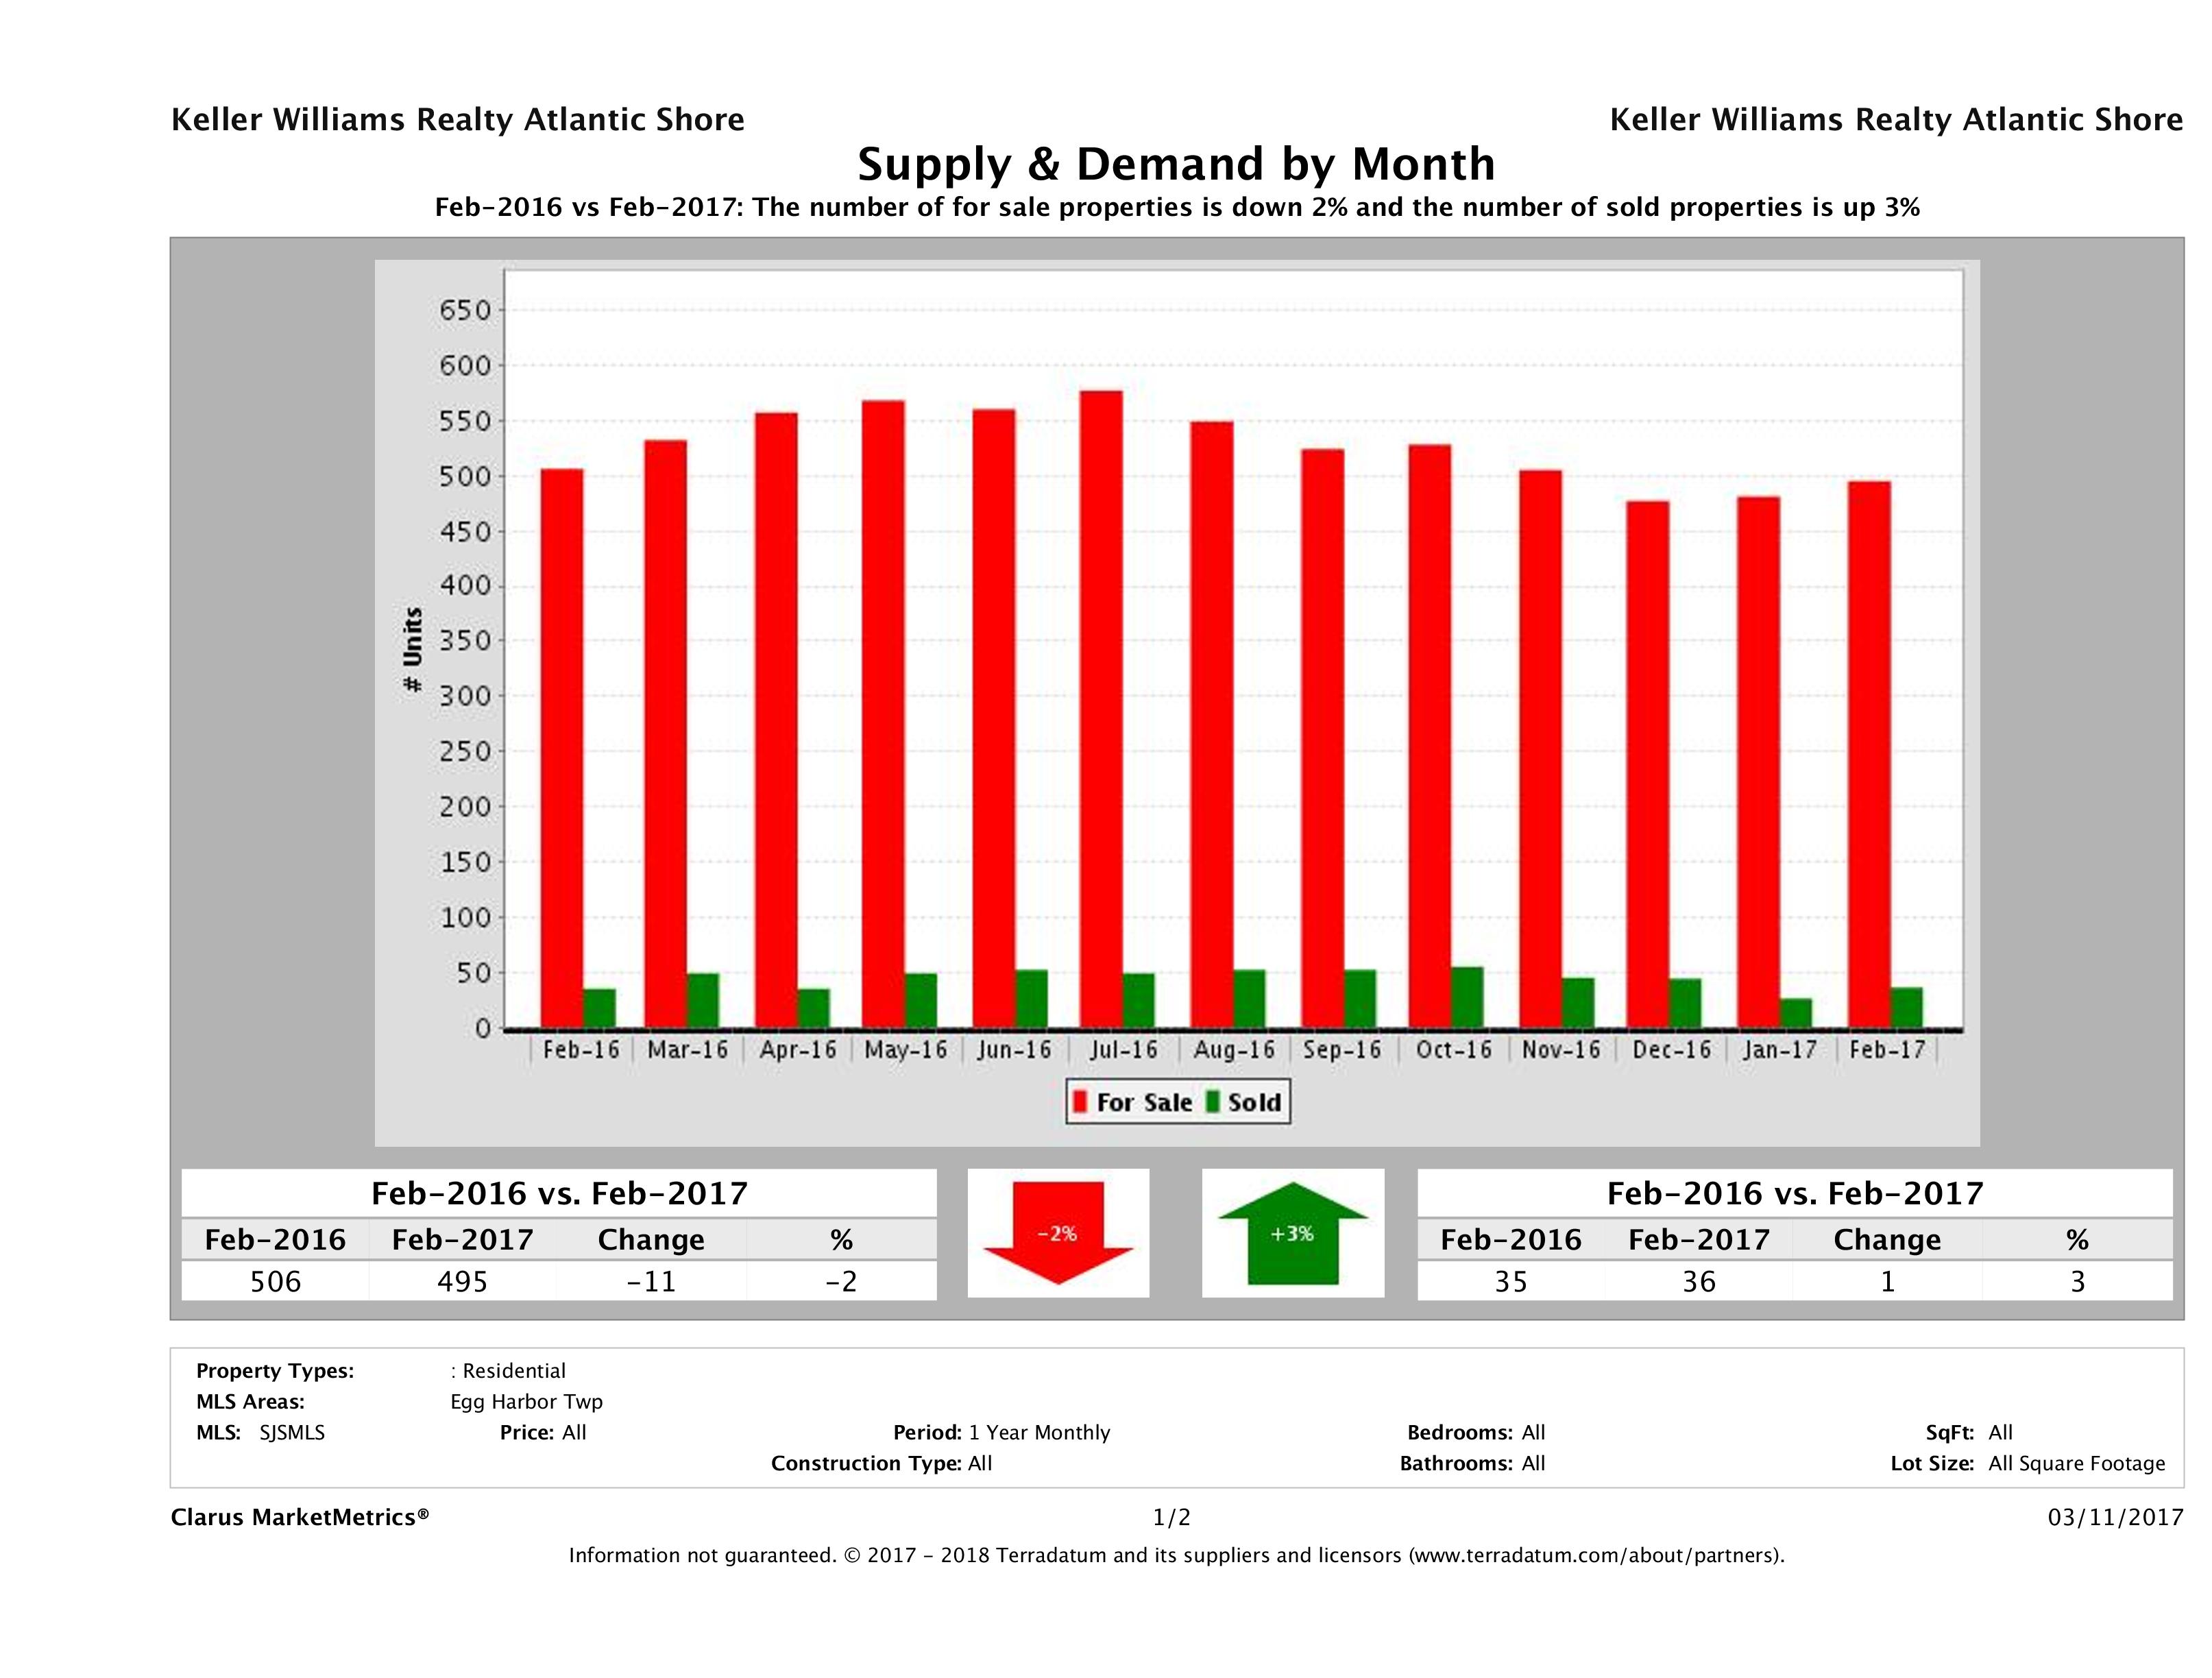
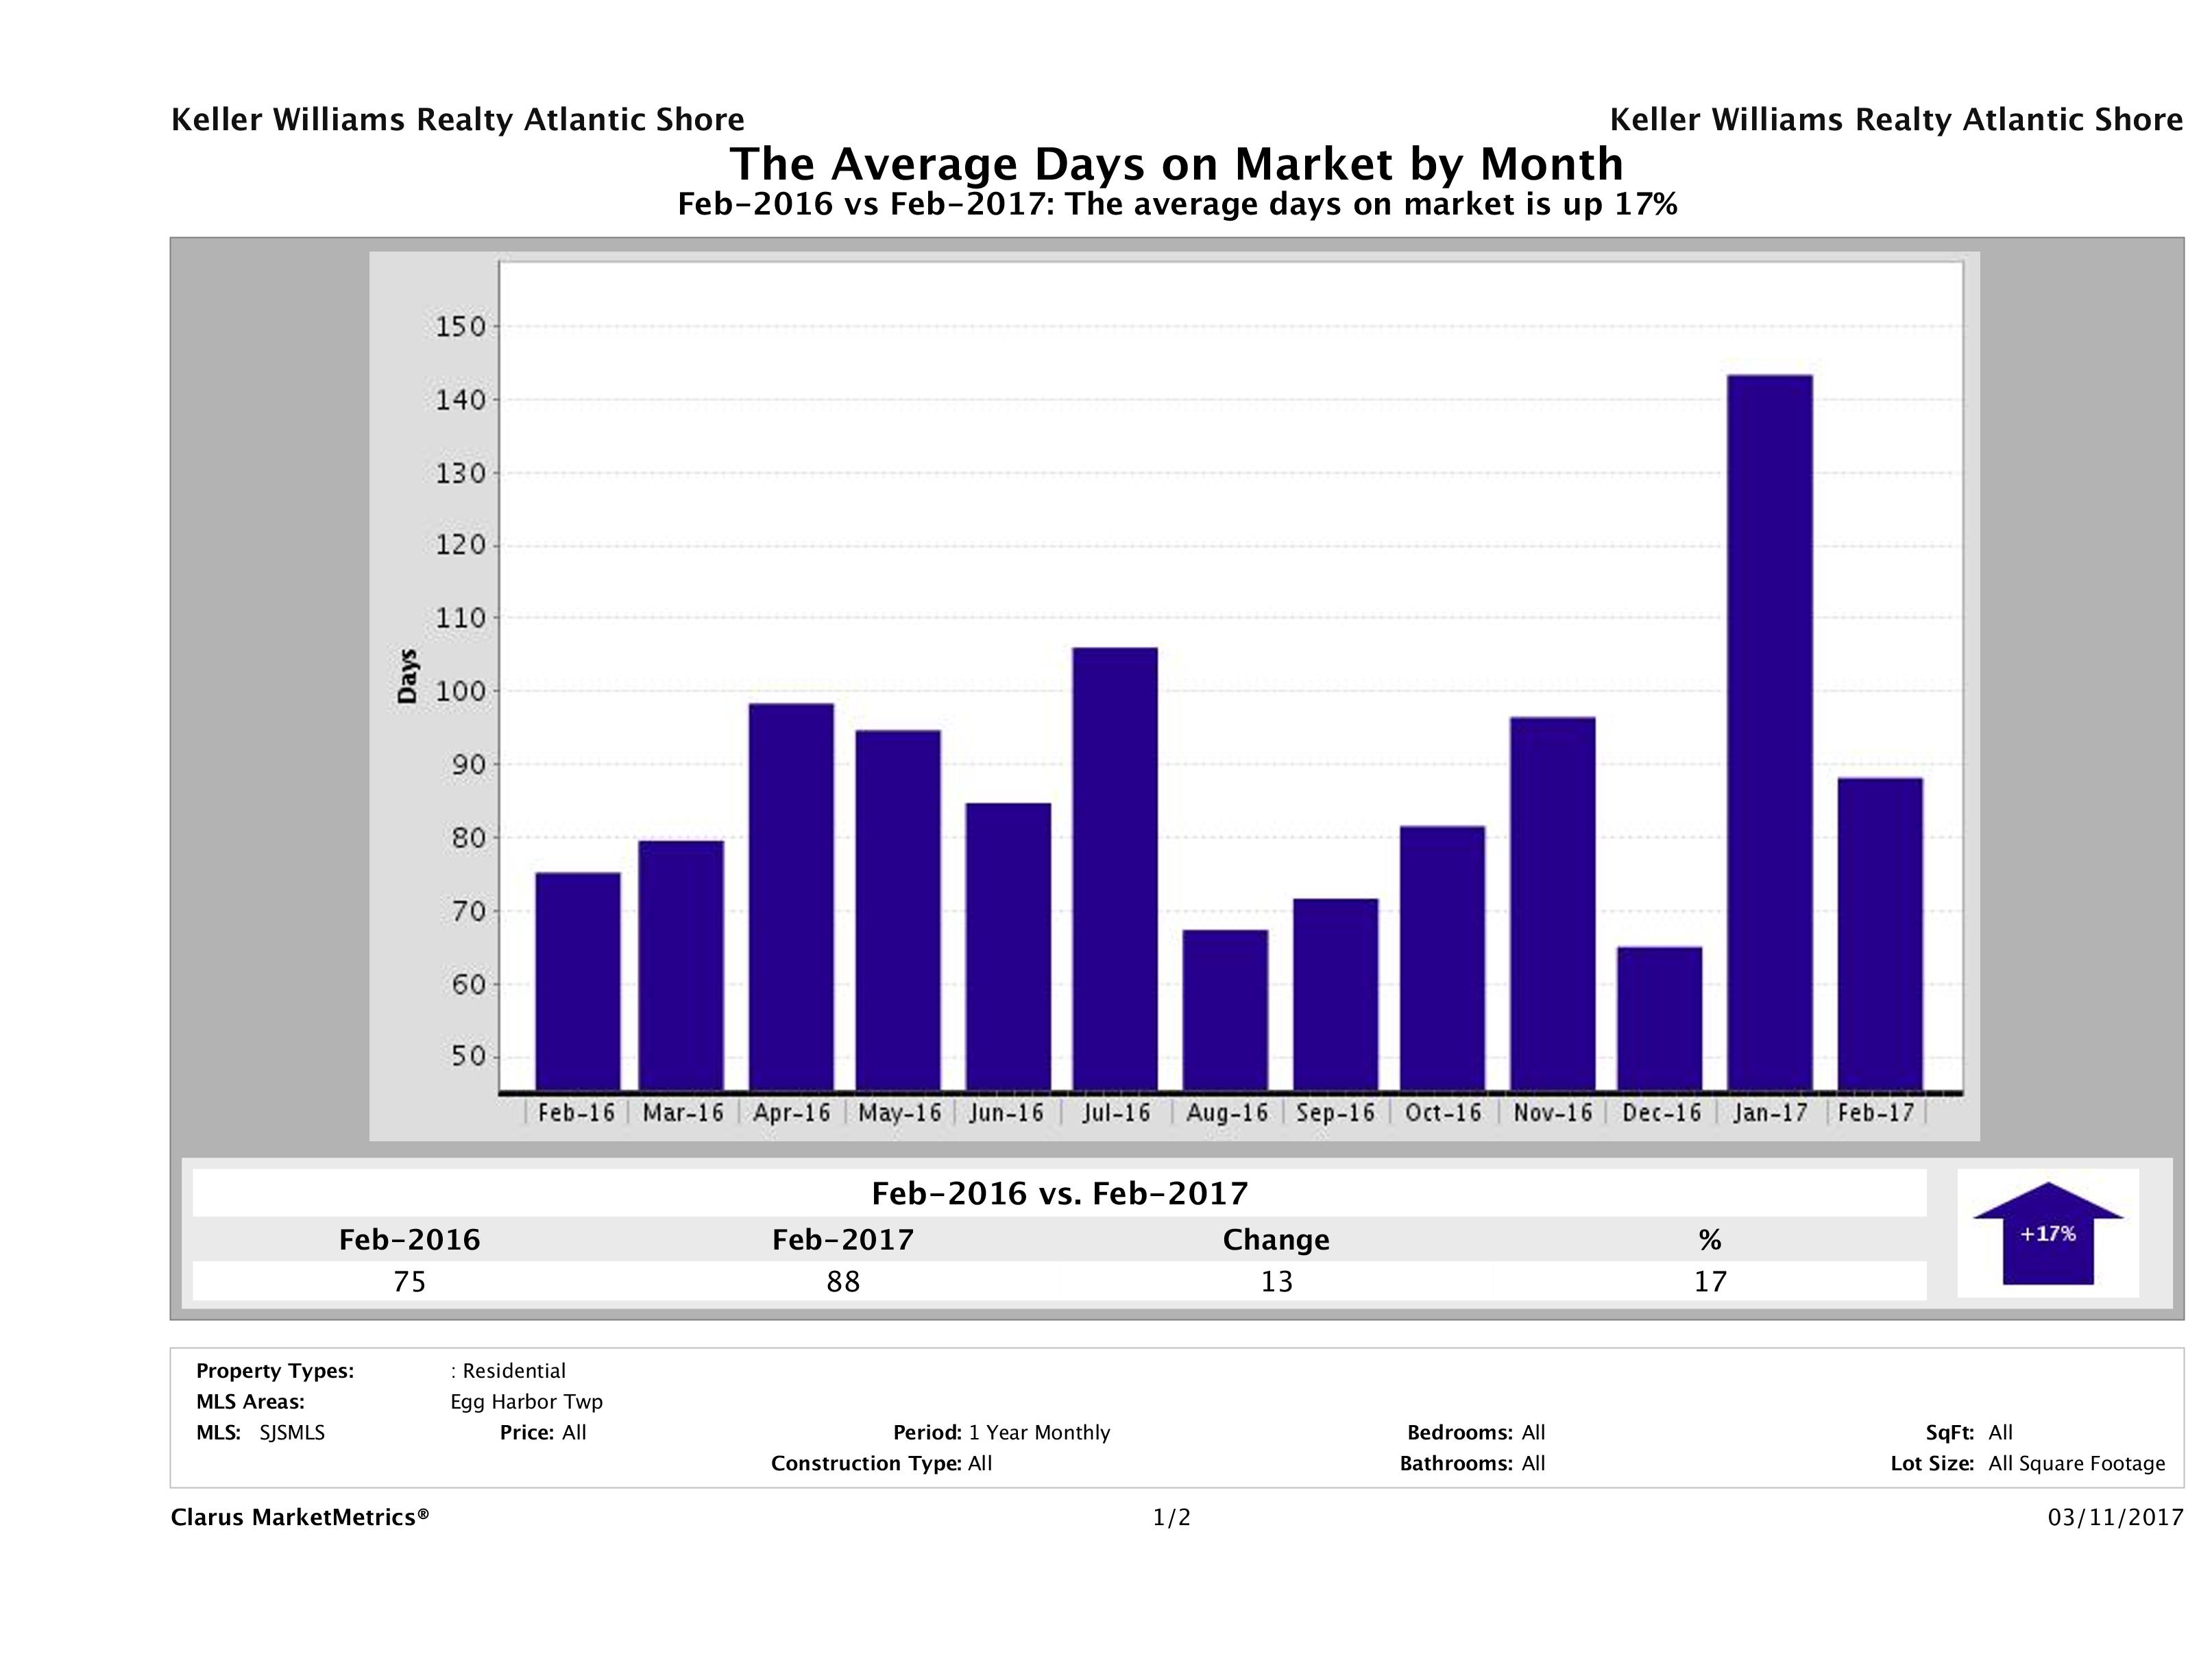
Here’s an update on the trends in the Egg Harbor Township, NJ real estate market.  This chart compares February 2019 with February 2018.  New listings were down 12.8%. Closed sales were also down slightly from 36 units to 33 units.  Days on Market decreased to 70 days.  Median Sales Price went up to $184,000. Up 1.4% from the previous year.  Percentage of list price received also went up to 98.2% of list price.

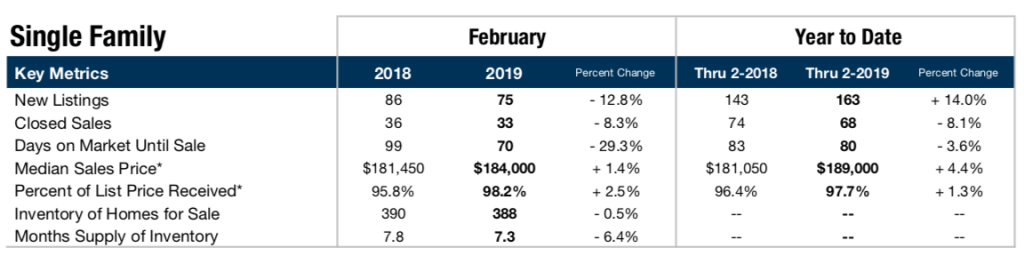
To interpret this it means that inventory is down and prices are up slightly.  This means we are moving slowly from a buyer’s market toward a seller’s market.  If you are thinking about selling your Egg Harbor Township home it may be a good time to consider selling now.  Also, If you’ve been waiting to buy a home now is a great time to buy before prices continue to increase.  I’f you’re considering buying or selling a home in Egg Harbor Township please contact us for a free consultation.

Contact Us Now

Margate City, NJ Real Estate Market Update

Here is a quick look at real estate statistics for Margate, NJ for December 2018

Margate is on of my favorite South Jersey Shore beach towns.  I prefer the Ventnor/Margate beaches in the summer because they are not as crowded as Ocean City.  Margate has more year round residents than some of the other shore tows.  Margate is also home to my favorite summer eatery the Margate Dairy & Burger Bar.  So lets take a look at the real estate market for Margate.

Margate City, NJ Real Estate Market Update

For single family homes new listings were down 40% and down 2% year to date.  Closed units were down 20% for the month and 5.5% year to date.  Days on market was just 50 days.  Median sales price was also up 8%.  Inventory of homes for sale is down 9.5%.

Margate City, NJ Real Estate Market Update

For condos and townhomes.  New listing were down slightly.  Closed sales were up 200% for the month and up 2% year to date.  Days on market was up in this category.  Median sales price was up 50% which indicates a few higher priced sales took place.  Median sales price is up 11.8% year to date.  Inventory of condos is down by 11% and months supply of inventory is down to 13 months.

If you or someone you know is looking to buy sell or invest in Margate real estate contact us now.  Inventory is shrinking and prices are on the rise.  This makes it a great time to sell and also a great time to buy before prices increase further.

Best wishes, Matt

Egg Harbor Township, NJ Market Statistics

What's happening in the real estate market September update

Houses for sale in Egg Harbor Township New Jersey

Here’s a quick overview of what’s happening in the real estate market in Egg Harbor Township.  Median sold price is down 6% to $190,000.  The median for sale price is up 2% and sold properties are down 2%.  New properties are down 9% and total inventory is down 19%.  

So even with lower inventories prices are still down overall.  My interpretation of these statistics indicate that the foreclosure properties that are still on the market are continuing to pull prices down.  At the same time some of the communities in Egg Harbor Township are very short on inventory and so there is a great possibility of price appreciation.  Contact me if you’d like to know how much your home is worth in today’s market.  To view full statistics for August 2017 Egg Harbor Township real estate click here:  egg-harbor-township-market-stats

Matt

Real Estate Market Update For Egg Harbor Township, NJ

One of the largest and most popular areas of our region is Egg Harbor Township.  I’d like to highlight some of the interesting market statistics derived from the multiple listing service to help home sellers and buyers in the area be aware of what is going on in the market.

This first chart shows the median for sale price and median sold price.  We look at the February 2017 numbers and then go back to compare those number with a year ago.  The median for sale price did not change.  The median sold price went down by 14%.

Egg Harbor Township, Median for sale and sold price. Feb. 2017.

The second chart shows supply and demand by month for Egg Harbor Township.  The red bar shows the supply of homes for sale and the green bar shows the number of homes sold.  Supply is down by 2% and sold properties are up by 3%.  This is good news for sellers.  You have less competition and more homes selling than this time a year ago.

The last chart shows the average days on the market up by 17% to 88 days on the market.  In this market as a seller you do not want to be average.  Our goal is to sell your home during the peak “window of opportunity” the first 4-5 weeks a home comes on the market.

Who do you know looking to sell or buy a home?  Please call me for a complementary consultation.

Best wishes,

Matt

Supply and demand for Egg Harbor Township, NJ, Feb 2017

Average days on market for Egg Harbor Township, NJ Feb. 2017

How To Be Up In A Down Real Estate Market

Our office numbers are way up. Here's why.

Despite a challenging seller’s market, high unemployment and lots of uncertainty our office has out performed the competition.  Why?  We treat our agents as partners and stakeholders.  We are the top training company in real estate and we study the market to be able advise our clients how to be successful in today’s new real estate economy.

Keller Williams Realty Atlantic Shore

COMPARING…

March 2015 to March 2016


Keller Williams Realty Atlantic Shore South Jersey Shore Regional Multiple Listing Service Outperforming the Market
Listings Taken Volume                         +23.28% 9.44% 13.84%
Listings Taken Units                   +46.94% 1.65% 45.29%
Closed Production List Side Volume +109.53% -6.35%       115.88%
Closed Production List Side Units +62.50% 4.54% 57.96%
Closed Production Total Volume +33.85% -6.35% 40.20%
Closed Production Total Units +18.60% 4.54% 14.06%

Matthew and Richard Haviland The Haviland GroupNumbers reported above are representative of South Jersey Shore MLS average percentages of all brokerages represented in the MLS.

Our MissionTo teach people how to consistently implement the Keller Williams models and systems so they can transform their lives and businesses.

Our Vision:  We are a passionate team of real estate leaders that attract extraordinary talent and wealth building opportunities.

When you’re choosing a real estate agent and company to work with consider Me, Matthew Haviland, and Keller Williams Realty Atlantic Shore.

Best wishes, Matt

P.S. For Great Articles and fun facts download and view my May Newsletter here:  May Newsletter – Matt

The Wildwoods & Diamond Beach Market Statistics For 4th Quarter of 2015

What's happening in the real estate market at The Wildwoods and Diamond Beach 2015

Here is an overview of the real estate market for The Wildwoods and Diamond Beach.  4th Quarter average sales price was $309,101.  This up 3% from the 3rd quarter of 2015 and up .07% from the 4th quarter of 2014.  Median sales price was a$255,000.  That’s a 6% increase from the 3rd quarter and a decrease of 8.8% from the 2014.  204 units sold in the 4th quarter of 2015.  That a decrease of 2.4% from the 3rd quarter and an increase of 8.5% from 2014.  Days on the market has gone down to 132.  That 3 days less than the 3rd quarter and 15 days less than it was a year ago.  Now is a great time to buy, invest and sell at the shore!  For more information on Wildwoods and Diamond Beach Real Estate contact me.  Matt

Wildwoods and Diamond Beach real estate statistics 4th quarter 2015

Wildwoods and Diamond Beach real estate statistics 4th quarter 2015

Ocean City, NJ Market Statistics 4th Quarter Of 2015

What's going on in the Ocean City, NJ Real Estate Market For 2015 4th Quarter.

Here’s what’s happening in the Ocean City, NJ real estate market:

Average sales price of $588,770 has gone down by 1% compared to the 3rd quarter of 2015 and down 1% from 4th quarter of 2014.  Median sales price of $481,000 is down 7% compared to the 3rd quarter and 1% down from 2014.  Sales volume of 222 units sold is down 7% from the 3rd quarter and up 2% from 2014.  Days on market has gone up also to 128 days on market.

Right now is a great opportunity to buy sell and invest in Ocean City.  Please contact me for more information on Ocean City, NJ real estate.  Matt

Market Report For Ocean City, NJ 4th quarter 2015.

Market Report For Ocean City, NJ 4th quarter 2015.